Abstract
Please reach out to the project Principal Investigator for more information.
dataset
Please reach out to the project Principal Investigator for more information.
policy brief
Delaying or forgoing health care can lead to serious health consequences. Since the onset of the COVID-19 pandemic, American health care utilization has dramatically shifted, and many aspects of transportation systems have been disrupted. In response to new and emerging health risks, economic hardship, and access challenges related to COVID-19, at least two in five adults had delayed health care by July 2020.1 Both directly and indirectly, the pandemic has amplified transportation challenges, which are a well-documented barrier to health care access. Public transit service schedules have been cut, reduced-cost shared-ride programs have been disrupted, and new concerns have arisen about the safety of relying on rides from people outside one’s household. Job loss, health insurance interruption, residential moves, and changes in how and where health care is offered have also influenced how people travel to care.COVID-19’s effects on transportation to health care are likely to disproportionately impact certain groups, with important implications for health equity. To understand the transportation needs of different populations during the pandemic, this report reviewed the literature across seven health care needs that are overrepresented among people with transportation challenges and/or amenable to transportation interventions. This included: (1) dialysis for end-stage kidney disease, (2) prenatal care, (3) cancer care, (4) mental health care and substance use treatment, (5) health care for people living with disabilities, (6) health care for people with multiple chronic conditions, and (7) preventive care.
policy brief
Since 2000, vehicle access has increased substantially in California. Between 2000 and 2018, the state added approximately 5.6 million automobiles, roughly one vehicle for every new resident. During the same time period, the share of households in California that do not own a car declined, dropping from 9.5% to just over 7%. Because automobile ownership is an extremely strong determinant of travel behavior, the increase in vehicle availability has important implications for transit use. Individuals living in households with at least one vehicle take the vast majority of their trips by car and have a relatively low likelihood of using transit. Those living in households without cars, by contrast, are a core constituency of transit systems. While less than 7% of households in California do not own a vehicle, these households take approximately 37% of all transit trips in the state.Even prior to the COVID-19 pandemic, transit ridership in California had fallen. From 2014 to 2018, California lost more than 165 million annual boardings, a drop of more than 11%. The close relationship between car access and transit use thus raises a crucial question: has the growth in automobile ownership in California over the past several years depressed the state’s transit ridership?
policy brief
Setting appropriate speeds on roadways requires balancing the economic and social benefits of higher vehicle speeds on one hand, against the greater safety, environmental, and human activity costs of fast-moving traffic on the other. While drivers and commercial shippers typically favor faster limits, those living, walking, biking, or playing in proximity to roads often want slower limits. The most common method for setting speed limits, however, leaves it to drivers to collectively decide how fast is too fast. According to the U.S. Federal Highway Administration (FHWA), most places in North America set speed limits using the “85th-percentile rule.” This long-established standard calls for observing the speeds of free-flowing traffic on a roadway without posted speed limits, and then setting the limit at a 5 mph increment above or below the speed at which 85% of vehicles travel. So, for example, if 85% of drivers on a particular road are observed to travel at 43 mph or less, the speed limit would be set at 45 mph.
policy brief
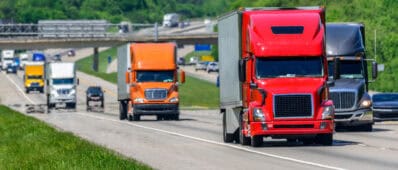
The trucking industry serves as the backbone of the nation’s economy. In 2018, approximately 3.5 million truck drivers were delivering over 70% of all freight tonnage in the United States, generating close to $800 billion in gross revenue annually. While 3.5 million truck drivers represents a significant number of jobs, it is not enough to satisfy demand. The trucking industry suffers from a chronic shortage of drivers. Nearly 70,000 additional heavy-duty tractor-trailer drivers in the United States were needed at the end of 2018, according to the American Trucking Associations. And COVID-19 has brought new challenges that may amplify or dampen the driver shortage and in turn impact supply chains. For example, what if a small percentage of long-haul truck drivers became ill? Would it cripple the industry? Would it significantly delay the delivery of essential medical supplies and equipment? This policy brief summarizes a study from UC Irvine exploring the challenges imposed by COVID-19 on truck drivers, looking at past crises, and interviewing academic and industry experts.
research report
There are two official sources of data on traffic incidents in California: 1) the Statewide Integrated Traffic Records System (SWITRS), intended to include incidents leading to injury or death; and 2) the California Highway Patrol (CHP) data on Caltrans’ Performance Measurement System, PeMS. Traffic safety researchers rely heavily on the post-processed SWITRS database, which provides only some crucial information about crashes. In 2015, the Road Ecology Center at UC Davis developed a third method to collect all incident data that appear on the CHP real-time incident-reporting website (https://cad.chp.ca.gov/). These data are assembled into a database called CHIPS, for California Highway Incident Processing System. Analyses indicate that the number of incidents recorded in a given period is similar in CHIPS and SWITRS but lower in Caltrans’ Performance Measurement System. Also, many SWITRS records (e.g., 36% in 2018), but no CHIPS records, lack or have inaccurate location information on incidents. Through case studies, the research group examined three ways that CHIPS can be used to support data and policy analysis. This report proposes future pathways for creating a more integrated system for collecting and analyzing crashes.
published journal article
Robo-taxis (automated vehicles operating in a ride-hailing model) have the potential to improve mobility while reducing traffic, emissions, and energy use. However, such outcomes depend largely on increasing riders per vehicle. Public policy that incentivizes industry to design robo-taxis to support ride-pooling may be critical to achieving positive outcomes. This research reviews current shared automated vehicle designs and literature related to potential consumer risks and benefits of ride-pooling in robo-taxis in order to articulate potential design solutions to promote pooling.
published journal article
We investigate whether the population of all vehicle-owning households has already considered purchasing a plug-in hybrid (PHEV) or battery electric vehicle (BEV). First, we explore purchase engagement and find that even in the city where the Zero Emission Vehicle (ZEV) policy originates (Sacramento, California) few consumers are engaged with PEVs, few have considered purchasing one, and many cannot name a single BEV or PHEV presently for sale, and many are not aware of incentives to buy or advertising of them. Next, we model purchase consideration using ordinal logistic models to understand correlations of purchase consideration with awareness of incentives, advertising, or ride and drives; whether respondents know how PHEVs and BEVs are fueled or the name of one for sale, have sought information on PHEVs and BEVs or have spoken to an owner; the density of chargers and PHEVs and BEVs in respondents’ home location; and respondent socio-demographics. We do not find any relationship between common engagement strategies (e.g. advertising, incentives, and ride and drives) and whether consumers have already considered buying a PHEV or BEV. Those who have considered purchasing a BEV or PHEV have done so due to prior interest.
policy brief
A large volume of research suggests that neighborhood attributes such as public transportation access, residential density, and walkability can have important impacts on people’s travel, carbon footprint, and employment opportunities. More often than not, however, the research conducted on this topic is subject to “self-selection bias.” For example, people who prefer to walk and ride transit are likely to move to neighborhoods that support these choices,while those who prefer to drive instead move to places with nearby highway access and ample parking. To overcome these biases, a research team at the University of California, Santa Cruz surveyed successful applicants to San Francisco’s affordable housing lotteries about their transportation choices and employment. In San Francisco, nearly all new housing developments with ten or more residential units must provide affordable housing units at below-market rates. The units are normally allocated to qualifying households through city-run lotteries. The chances of winning a lottery are small — less than two percent — and so, not surprisingly, households are not selective about which lotteries they enter. Analysis of lottery application data shows that applicants do not appear to enter any particular lottery based on where they would end up living, or if the residence has ample parking, or based onthe neighborhood’s walkability or transit accessibility.
policy brief
Tractor-trailers dominate the truck cargo industry. Between 1990 and 2010, this industry grew significantly; vehicle miles traveled increased 87 percent and ton-miles increased by 47 percent. While the growth of trucking miles and tonmiles is a positive indicator of economic transformation and expansion, the trucking sector also produces negative externalities, including but not limited to pavement damage. Pavement damage is closely tied to vehicle weight, which is a product of private market decisions driven by the cost of delivery per ton and the frequency of delivery. Understanding the interplay between fuel cost and private sector decisions on truck dispatch (i.e., frequency and load of trucks) is key to understanding infrastructure damage.